Исследование эволюции волатильности в её слоях
Пучков Андрей Александрович,
магистр экономики, докторант Рижского технического университета.
Stock Indexes Volatility Evolution Research in Volatility Layers
Andrejs Puchkovs,
Economist, Mg. oec., PhD student of Riga Technical University.
This article describes results of stock index analysis by using wavelet filtering. Wavelet filtering is applied by using Direct and Inverse CWT for each scaling parameter. Thus for each scaling parameter the signal component (which is part of the original signal) is calculated. For subsequent research volatility indicator is analyzed by using 20-days time window, which is shifted on the time axis. Volatility analysis is done for each signal component. As a result volatility evolution in time is obtained for each signal component. According to research, a slight increase in volatility in the low-frequency components of the signal leads to significant disturbances in high-frequency components destine entire signal volatility growth.
1. Research algorithm
Research algorithm of stock market data is proposed in previous works [6,7]. Algorithm is shown in the next figure. Research includes three main blocks - Data mining and preprocessing block, Signal decomposition block and Signal analysis block.
Data mining and preprocessing block intend for financial data mining and preprocessing. The block is placed before Signal decomposition and analysis blocks. Data mining and preprocessing block has three main elements: Data loading operation, Taking logarithm operand and Normalization operand. ’Loading data’ operation is completed in early beginning by using automatic financial time series data download from ’finance.yahoo.com’ source.
Signal decomposition block is placed between Data mining and preprocessing block and Signal analysis block. The block consist of two parts: Direct Continuous Wavelet Transform (Direct CWT) and Inverse Continuous Wavelet Transform (Inverse CWT) operands. [2,3] Since analyzed signal is decomposed in parts, Direct CWT and Inverse CWT operands are working in loop, providing decomposed parts of analyzed signal for each scaling parameter a. In the output Signal decomposition block provides decomposed parts of the signal for each scaling parameter a, in fact, these are a components of (original) analyzed signal, which are analyzed separately in the Signal analysis block.
At the end Signal Analysis block brings light on volatility evolution research. Signal Analysis block consist of two blocks - Volatility research subblock and Volatility evolution research subblock. Volatility research subblock use decomposed parts of analyzed signal in input and provides volatility indicator in output. Volatility research subblock consist of two parts: time-window function (which selects 20-days data and shifts time-window to the end) and volatility analysis operand (which is measuring volatility indicator of selected data). Volatility research subblock is measuring volatility for each part of decomposed signal and in each time-window. Volatility evolution research subblock intend to discover complicated interdependences between volatility layers and mechanism of volatility transmission between volatility layers. Detailed representation of algorithm is made in previous works. Computational aspects of analysis are considered in expected publication in current journal.
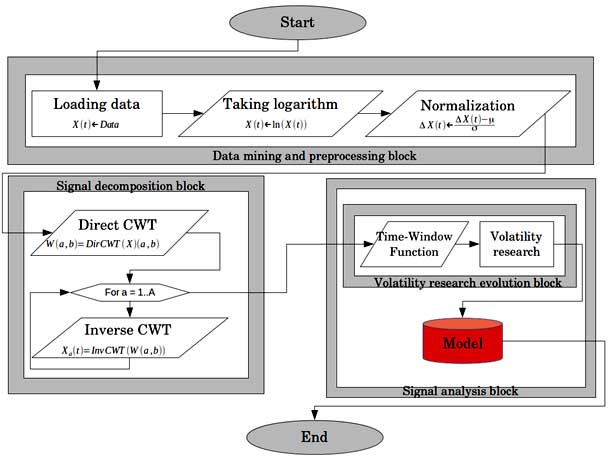
Fig. 1. Algorithm of research.
Research includes three main blocks - Data mining and preprocessing block, Signal decomposition block and Signal analysis block.
2. Preprocessed stock indexes
Preprocessed signals (Analyzed signals and stock index additions) are shown in the next of in the next figure.
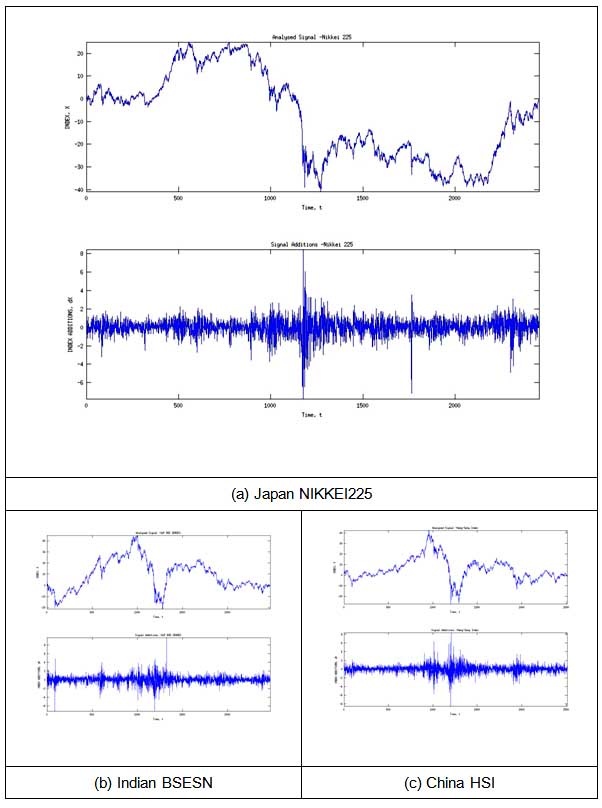
Fig. 2. Stock indexes and stock index additions.
As it is shown in 2. fig., all indexes were affected by financial crisis 2007, Indian and China indexes look have similar dynamics. At the next step considered indexes are decomposed by using wavelet filtration.
3. Decomposed stock indexes
Decomposed stock indexes represent a lot of information. Since index as a signal is decomposed in large number of parts or components, there is opportunity to trace dynamics of each component separately. Some of them are hardly noticeable, that's why wavelet filtering (Direct and Inverse CWT) is acting like magnifying glass or a microscope, providing picture in various scales simultaneously.
Low-frequency components are 'trendy' parts of the signal and have profound analogy with long term investments, but high-frequency components have profound analogy with short term investments (where trading is happening rapidly, often under the influence of emotions). [11] Stock indexes decomposition is provided in the next figure.
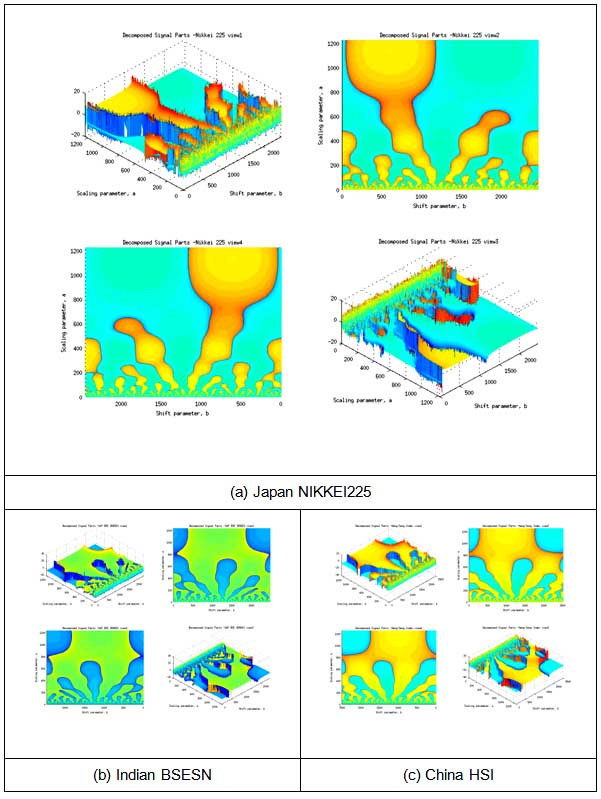
Fig. 3. Decomposed Stock indexes.
Author consider the most dramatic events in financial markets could be foretasted on early stages. According 3. fig. surges (or burst) in low-frequency components predate surges or burst in high-frequency components. Energy of signal in low-frequency components is low and this effect is hardly noticeable. Wavelet filtering allow to illuminate this parts and trace volatility or energy transmission from low-frequency components to high frequency components.
According 3. fig. surges in Japan NIKKEI225 in low frequency components are less noticeable than in Indian BSESN and China HSI; BSESN and HSI have more clearly visible dynamics of volatility transmission to high-frequency components, which may predict overall volatility burst in future.
4. Stock indexes volatility analysis
Here and further a volatility in each signal component is analyzed. According research volatility bursts on low frequency components predate overall volatility bursts. Volatility is transmitted from low frequency components to high frequency components (this effect is called 'Noth-East Volatility Wind'), in this moment overall volatility burst is happening, then volatility is transmitted back (or back) to low-frequency components (where it becomes hardly noticeable). There is analogy between volatility transmission between layers and ocean wave. The wave far from the cost line is hardly noticeable, but when it comes to the cost line it becomes very sharp and noticeable. The same thing is happening in the stock markets, when hardly noticeable volatility wave comes to the lower scale (high-frequency) components.
In the next figure a volatility indicator (logarithmic volatility) are shown on top-plots of each figure; bottom plots are showing volatility indicator derivatives (by layer index a or time t).
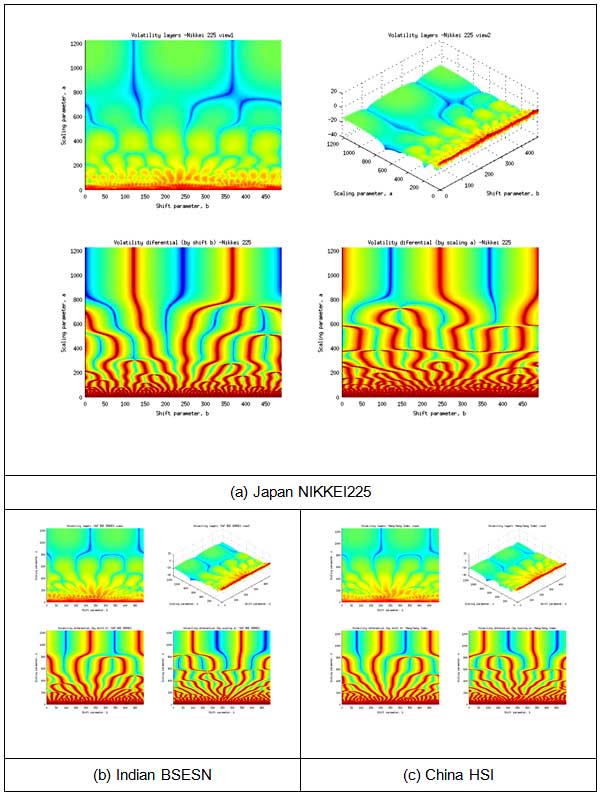
Fig. 4. Stock indexes volatility research.
Volatility burst on middle-frequency components and volatility transmission to high-frequency components are indicating financial crisis in middle-term perspective for selected stock indexes. For NIKKEI225 it should come faster, but for Indian BSESN and China HSI it should be more dramatical.
5. Stock indexes volatility evolution in a complex plain
Volatility transmission between volatility layers in time is very important aspect of research. A very beneficial way of volatility transmission representation is representation in a complex plain. Detailed illustration is proposed in expected publication in current journal.
Here and further volatility transmission is illustrated on the Dow Jones Industrial Index (DJIA) data. The picture of transmission of volatility from low-frequency components to the high-frequency components is a typical picture of so called financial market crisis.
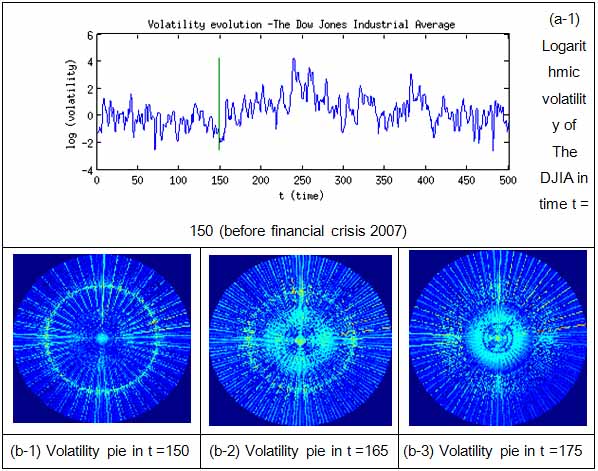
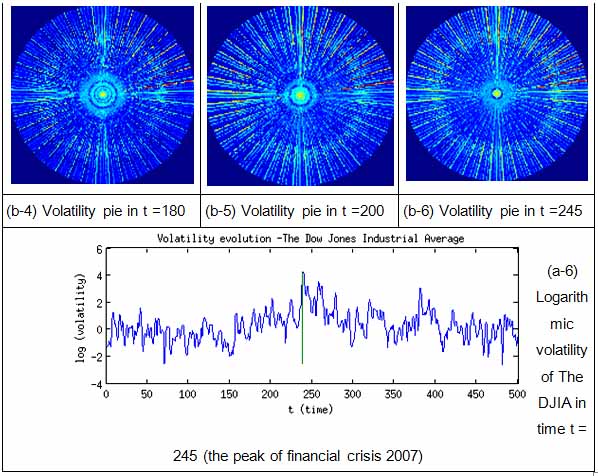
Fig. 5. Logarithmic Volatility indicator, Volatility transmission in time.
A typical picture of financial market crisis is 'implosion' – while logarithmic indicator rise, interlayer volatility radius becomes clenched, during overall volatility peak became a small bright point. In other words energy of signal is transmitted to the highest frequency components.
During market stabilization a the picture of financial market is changing to 'explosion' , since interlayer volatility radius is growing. In this phase volatility is rolling back, or in other words volatility is transmitted to a low-frequency components.
Significant volatility bursts are happening when two opposing waves come one two another. Evolution of volatility waves has a very sophisticated nature, which expected to be discovered in details in subsequent research.
Interlayer transmission of volatility, represented in a complex plain is beneficial, since it brings out opportunity to decrease dimensions and use interlayer volatility radius instead of volatility layers indexes.
Bibliography
1. Кроновер. Фракталы и хаос в динамических системах. Основы. теории. М: Постмаркет, 2000. — 352 с. – 293. стр.
2. сМОЛЕНЦЕВ. Основы теории вейвлетов в MATLAB. М: ДМК Пресс, 2003. - 304. стр.
3. Яковлев. Введение в вейвлет преобразования. Новосибирск, 2003. – 104 стр.
4. Mathworks.com. Continuous 1-D wavelet transform. [http://www.mathworks.se/help/wavelet/ref/cwt.html] (Accessed 1 January. 2014).
5. Mathworks.com. Continuous wavelet transform using FFT algorithm. [http://www.mathworks.se/help/wavelet/ref/cwtft.html] (Accessed 1 January. 2014).
6. Mathworks.com. Inverse CWT. [http://www.mathworks.se/help/wavelet/ref/icwtft.html] (Accessed 1 January. 2014).
7. PUCKOVS, A., MATVEJEVS, A.: Equity Indexes Analysis and Synthesis by using Wavelet Transforms. CFE 2013 7-th International Conference on Computational and Financial Econometrics, London: Birkbeck University of London, 2013, ISBN 978-84-937822-3-8, p. 98.
8. PUCKOVS, A., MATVEJEVS, A.:’North-East Volatility Wind’ Effect. No: 13th Conference on Applied Mathematics (APLIMAT 2014): Book of Abstracts: 13th Conference on Applied Mathematics (APLIMAT 2014), Slovakia, Bratislava, 4.-6. Feb., 2014. Bratislava: 2014, 67.-67.pp. ISBN 9788022741392.
9. TREFETHEN, L. N. Spectral Methods in MATLAB. Comlab, 2007, 160 s.
10. Finance.yahoo.com. HANG SENG INDEX (^HSI)- [https://finance.yahoo.com/q/hp?s=^HSI+Historical+Prices] (Accessed 1 April. 2014).
11. Finance.yahoo.com. Nikkei 225 (^N225) - [https://finance.yahoo.com/q/hp?s=^N225+Historical+Prices] (Accessed 1 April. 2014).
12. Finance.yahoo.com. S&P BSE SENSEX (^BSESN) - [https://finance.yahoo.com/q/hp?s=^BSESN+Historical+Prices] (Accessed 1 April. 2014).
13. Youtube.com. Advanced Digital Signal Processing-Wavelets and multirate by Prof.v.M.Gadre,Department of Electrical Engineering, [http://www.youtube.com/watch?v=RBZQDBNdzWk&list=PLarWa9wEKs_H3Go20IYoDR26t6XnX6tZj] (Accessed 1 January. 2014).
14. www.youtube.com Complex Number. [http://www.youtube.com/watch?v=b3adw5igSzI] (Accessed 1 January. 2014.).
15. www.youtube.com Complex Number Theory. [http://www.youtube.com/watch?v=b3adw5igSzI] (Accessed 1 January. 2014.).
16. Youtube.com. Lecture Series on Digital Signal Processing by Prof.T.K.Basu, Department of Electrical Engineering, IIT Kharagpur. [http://www.youtube.com/watch?v=V-kLaH4139o&list=PLBC201E07F0818B5A] (Accessed 1 January. 2014).
17. Youtube.com. Lecture Series on Digital Voice and Picture Communication by Prof.S. Sengupta, Department of Electronics and Electrical Communication. [http://www.youtube.com/watch?v=kp2zPGpKd74] (Accessed 1 January. 2014).
Поступила в редакцию 15.05.2014 г.