Статистические показатели качества результатов тестирования
Кухар Людмила Александровна,
аспирант Национального педагогического университета им. М. П. Драгоманова, г. Киев, Украина.
Statistical exponents of the quality of the test results
Kukhar Liudmyla
senior lecturer of department of computer engineering Institute of Informatics National Pedagogical Dragomanov University, Kyiv, Ukraine.
Statistical elaboration of test results in the environment of Microsoft Excel electronic tables may include the following steps:
1. Working with a matrix of test results.
2. Defining selective characteristics of test results.
3. Checking the normality of the scores’ allocation of test results.
4. Establishing the validity of test results.
5. Determining the reliability of the text.
Let us consider each of the stages.
Stage 1. Working with a matrix of test results.
Test results are introduced in a matrix which includes estimates for the test in dichotomous scale (0 for a wrong answer and 1 for the right answer). Deletes rows and columns containing only zeros or units since the matrix of test results.
Individual mark of examined person we get by adding all grades earned for the tasks of the test. For convenience, place the individual grades (xi) in the last column of the matrix results.
The number of correct answers on the test task (yi) we get by calculating the amount of points placed in columns (Pict. 1).
The value of individual grades must be sorted in ascending order.
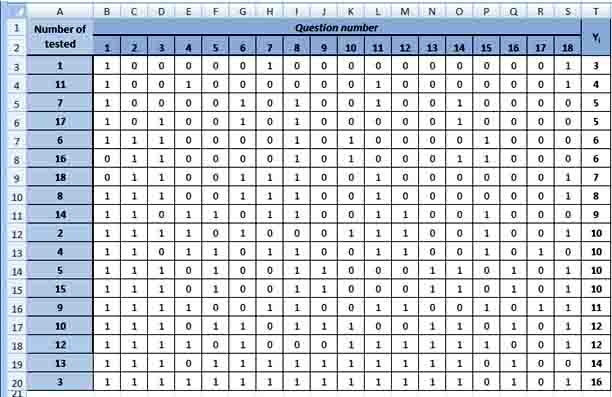
Pict. 1. The matrix of test results.
Stage 2. Defining selective characteristics of test results.
At this stage it is necessary to determine the average value, mode, median, variance, standard deviation of the sample. All functions are used to determine the characteristics of the sample belong to Statistical category.
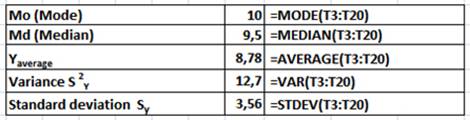
Pict. 2. Selective results of descriptive statistics.
Discrimination and complexity of the test can be determined besides descriptive statistics parameters.
Discrimination is the ability of separate tasks of the test and the test generally differentiate examined persons relatively the maximum and minimum test results. Indicator of separate ability is used only for tasks that are evaluated in a dichotomous scale. It is calculated by the formula where - the proportion of examined persons that correctly completed j task in a subgroup of 27% better than the results of the test - the proportion of test that correctly completed j task in a subgroup of 27% worse than the results of the test.
The index belongs to the interval [-1;1].
|
A range of indicators of discrimination |
Interpretation of exponents |
|
|
Tasks functions satisfactorily |
|
|
Need a small correction of the task, or if it is not necessary |
|
|
The task is needed to revise |
|
|
It is needed to remove the task from the text or completely rework |
The first question does not work because it needs to be removed, issues 15, 17, 8 – need to be review, all other tasks are functioning satisfactorily.
The complexity of the test tasks is characteristic that reflects the level of statistical solvability in the sample standardization. Typically, it is estimated by comparing the number of examined persons that correctly completed the task to the total number of examined persons. This index varies from 0 to 1. Its value increases with the complexity of the task.
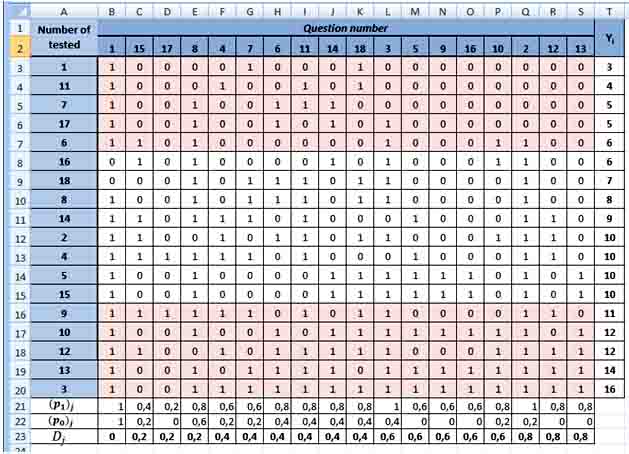
Pict. 3. Determination of the discrimination’s index by MS Excel.
It is accepted to separate sub-objective and statistical (objective) complexity. Subjective task complexity associated with individual barrier, whose value is defined as the circumstances (time constraints, availability of manuals, etc.) as well as the level of needed formation for determination of knowledge, skills, mental state of the subject and a number of other factors. The impact of the complex of these factors on the result of the test reduces the reliability and accuracy of the data, so it is important to take steps to plane them with the directional impact of acquisition sample and standard procedures for testing.
An indication of the complexity of the task as the statistical complexity is the proportion of sample persons who solved and did not solve the task.
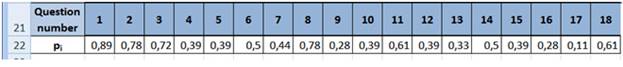
Pict. 4. Complexity of the tasks the test.
|
The range of indices of the test tasks’ difficulty |
Interpretation of indicators |
|
0 – 0,19 |
Very difficult tests |
|
0,2 – 0,49 |
Difficult tests |
|
0,5 – 0,69 |
Tests average level of complexity |
|
0,7 – 0,89 |
Simple tests |
|
0,9 – 1 |
Very simple tests |
Stage 3. Checking the normality of the scores’ allocation of test results.
Among the methods of evaluation of the laws of probability distribution of random variables about two dozen have been specifically designed to check normality. The most common are considered:
- Criteria of asymmetry and excess;
- Xi-square;
- Shapiro-Wilk’s criterion and others.
Criterion of asymmetry and excess is used for approximate checking the hypothesis of normality of the empirical distribution. Establishment of asymmetry and excess allows setting the symmetry of distribution of a random variable. It is considered that in the normal sample distribution of the indices of asymmetry and excess reach zero, but in practice it is almost not observed.
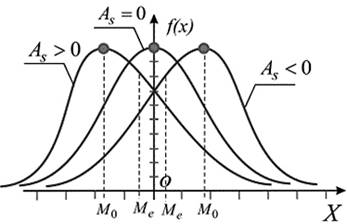
Pict. 5. Graphical interpretation of the distribution’s asymmetry of the test grades.
Asymmetry characterizes the degree of curve’s dissymmetry of the empirical distribution of the test grades. The presence of asymmetry is easy to establish visually analyzing the polygon’s frequency or histogram. Typical positive asymmetry is for difficult test and negative - for easy test. For the normal distribution is characterized by a zero asymmetry, which is understandable, since full symmetry of each value grade, which is smaller than mean value, is balanced by other symmetrical, larger than average.
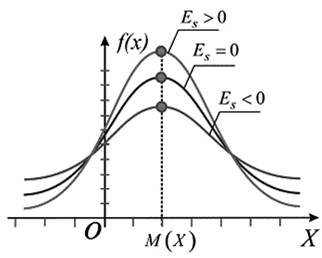
Pict. 6. Graphical interpretation of the distribution’s excess of the test grades.
It can be got an idea with excess of whether the frequency’s distribution is peaked, middle peaked or flat. (Excess is a measure of the curvature’s distribution of units of examined persons for the characteristic value (test grades).
|
Asymmetry |
0,21 |
=SKEW(T3:T20) |
|
Excess |
-0,53 |
=KURT(T3:T20) |
Distribution of “xi-square” is used to assess the variance (with confidence interval) when testing hypotheses consent, homogeneity, independence, especially for qualitative (categorized) variables taking finitely many values, and many other tasks of statistical data analysis. On the base distribution of “xi-square” was built one of the most powerful criteria consent – Pierson’s criterion of “xi-square”.
Criterion calculation formula follows as:
![]() (1)
(1)
where m and m’ – accordingly empirical and theoretical frequency of under study distribution; n - number of liberty degrees.
To check, we need to compare the empirical (observed) and theoretical (calculated under the condition of normal distribution table for critical values) frequency.
If empirical frequencies coincide with the frequencies calculated or expected and criterion χ2 will also be equal to zero. If ![]() , it points to the irresponsibility of the calculated
frequencies empirical frequencies range. In such cases it
is necessary to evaluate the significance
criterion χ2, which can theoretically vary from zero to infinity.
, it points to the irresponsibility of the calculated
frequencies empirical frequencies range. In such cases it
is necessary to evaluate the significance
criterion χ2, which can theoretically vary from zero to infinity.
This can be done by comparing the actual value obtained ![]() from its critical value
from its critical value ![]() .
.
The zero hypothesis, i.e. the assumption that the difference between empirical and theoretical or expected frequencies is random, it is refuted, if adopted significance level (a) and the number of liberty’s degrees (n).
![]()
Application of criterion χ2 for evaluation of discrete distributions is connected with some errors, which affect its value, especially on scanty samples. To obtain more accurate estimates sampling variation displayed in a row must have at least 50 items.
Shapiro-Wilk’s criterion is used to test the hypothesis H0: “random value X has a normal distribution and is one of the most effective test criterion of normality. The criterion which checking normality of the sample is special case of criterion consent. Shapiro-Wilk’s criterion is based on the optimal linear undisplaced unit of variance to its usual estimation by method of maximum likelihood.
The statistics of Shapiro-Wilk’s criterion W looks like:
![]() (2)
(2)
![]() (3)
(3)
n - sample size.
Let us verify the hypothesis with Shapiro-Wilk’s criterion of conformity to normal law of distribution of empirical data.
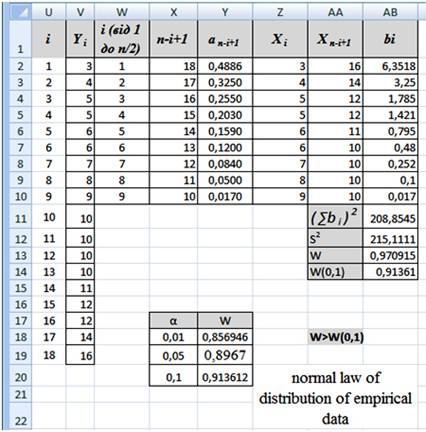
Pict. 7. Implementation of Shapiro-Wilk’s criterion among MS Excel.
Stage 4. Establishing the validity of test results.
The choice of the method of measuring the level of knowledge based on the criteria that determine the quality of the measuring means. The most important quality criteria are validity, objectivity, reliability and accuracy. Let us consider their definitions and define the meaning of each.
The fundamental criterion is validity. The notion of validity is used for the general characteristics of the test in terms of the responsibility of the results, aim and requirements assessment.
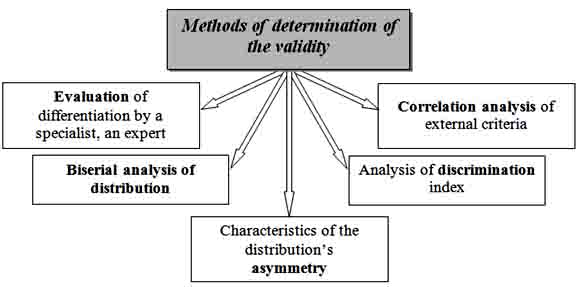
Pict. 8. Methods of determination of the validity.
Correlation analysis is used to process the results of research. However, depending on the types of scales, which measured the studied signs, methods of correlation analysis differ.
|
Type scales |
The method of correlation analysis |
|
|
Variable x |
Variable y |
|
|
Interval or scale relations |
Interval or scale relations |
Pearson’s correlation coefficient |
|
Interval or scale relations |
Interval or scale relations |
1. Rank correlation coefficients (Spearman and Kendall) 2. Fechner’s coefficient |
|
Interval or scale relations |
Ordinal |
Rank correlation coefficients (Spearman and Kendall) |
|
Ordinal |
Ordinal |
Rank correlation coefficients (Spearman and Kendall) |
|
Interval or scale relations |
Dichotomous |
Biserial correlation coefficient |
|
Rank |
Dichotomous |
Rank and biserial correlation coefficient |
|
Dichotomous |
Dichotomous |
1. Coefficient of association 2. Correlation coefficient signs |
|
Nominal |
Nominal |
Coefficient of mutual contingency |
A correlation matrix can be constructed by means table Microsoft Excel that reflects the relationship of the studied elements to calculate the Pearson’s correlation coefficient, dotty and biserial coefficient.
Stage 5. Determining the reliability of the text.
Reliability of measurement methods it is a measure of results that affect the accuracy with which you measure this or that particular feature. Checking the reliability of the method applies primarily to recovery results in repeated measurements.
The degree of reliability of the method depends on the objectivity of the method, the parameters of measurement and stability characteristics, which is measured. It is determined by the coefficient of reliability - the correlation coefficient, which indicates compliance of the results of measurements made under the same conditions by one person (i.e. the way in which the results of measurement are reproduced).
|
Type of reliability |
Determination’s method of reliability |
|
Retested |
Pearson’s formula Rank correlation coefficient of Spearman or Kendall) |
|
Expert |
The correlation coefficient between the various estimations of experts |
|
Parallel forms |
The correlation coefficient between the results of testing various forms The correlation coefficient between the results of initial and secondary research |
|
Parts of the test |
Spearman-Brown’s formula Ryulon’s formula |
|
Separate tasks of the test |
Kyuder-Richardson’s formula Cronbach’s formula |
Some researchers in the field of testology suppose reliability is one of the criteria as a test, with the thought that the degree of reliability is a stable characteristic of the test. However, the strong influence on the reliability of the degree of homogeneity is investigated groups, level of training, as well as other factors connected not only with the test, but the terms of its conducting. Therefore, in recent years, often analyze the reliability of measurement as a result of testing in certain circumstances and not as a general characterization of the test method.
Let us characterize the types of security and basic approaches and methods for its determination:
Reliability multilevel test can be determined using the method of the reliability of individual tasks, such as calculating Kyuder-Richardson’s coefficient. This reliability is calculated according to data of a single-use test.
 (4)
(4)
N – quantity of tasks in the test; σx2 - dispersion initial estimates of test results; p – index of difficulty of tasks (proportion of examined persons who coped with the task, defined as the probability of a correct answer for i-те task by all examined persons), q=1–p (proportion of examined who did not cope with the task).
Any coefficient of reliability can be interpreted as a percentage of the variance indices.
Thus, if reliability’s coefficient is 0.74, it indicates that 74% of the variance of test results depends on the true variance of the measured properties, and 26% - on the dispersion error.
In Microsoft Excel there is implementation of task for determining reliability’s coefficient as follows:
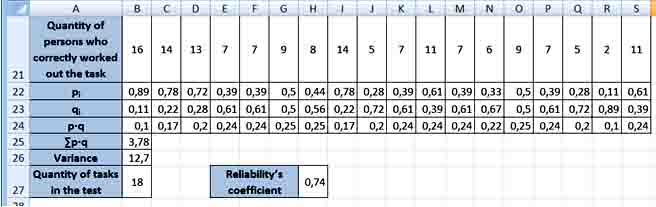
Pict. 9. Implementation of task for determining reliability’s coefficient.
Scientists and conducted researches make it possible to assert that the length of the test (number of tasks) depends on its reliability (ceteris paribus). Spearman-Brown’s formula allows us to estimate the required length of the test for a given value of reliability.
Reliability’s coefficient after change of the length of the test is calculated by the formula:
![]() (5)
(5)
k – multiplicity measure of the test’s length; rt– reliability’s coefficient to change of the test’s length.
Conclusions. Conducted researches let us conclude about the availability of means and methods, which are necessary to create quality test materials, statistical processing of conducted tests’ researches and their possible improvements based on the received results. The use of means of electronic tables of MS Excel provides implementation of all five described stages, which is enough to check the basic postulates of the classical theory tests.
Further research will be focused on the use of correlation analysis for determining the quality of test materials, standardization and factorization of tests.
References
1. Rudenko V.M. Matematychna statystyka / V.M. Rudenko. – K.: Tsentr uchbovoyi literatury, 2012. – 304 s.
2. Gmurman V.E. Teorija verojatnostej i matematicheskaja statistika / V.E. Gmurman. – M.: Vysshaja shkola, 1999. – 479s.
3. Majorov A. N. Testy shkol'nyh dostizhenij: uslovija i procedura provedennja testov / A. N. Majorov // Shkol'naja psihologija. – 1999. – № 5. – S. 206–235.
4. Kroker L., Algina Dzh. Vvedenie v klassicheskuju i sovremennuju teoriju testov: Uchebnik. – M.: Logos, 2010. – 668 s.
Поступила в редакцию 09.01.2014 г.